There’s been a lot of discussion this weekend about the approach proposed by the UK government for handling the Coronavirus epidemic and how it compares to the approach adopted by most other countries so far. The best explanation I’ve seen of the UK approach is contained in a thread of tweets by Professor Ian Donald of the University of Liverpool. The thread starts here:
1. The govt strategy on #Coronavirus is more refined than those used in other countries and potentially very effective. But it is also riskier and based on a number of assumptions. They need to be correct, and the measures they introduce need to work when they are supposed to.
— Professor Ian Donald (@iandonald_psych) March 13, 2020
A strong counterargument setting out arguments against this approach is given here.
I’m in no position to judge whether the UK approach is less or more risky than that adopted by, say, Italy, who have taken a much more rigorous approach to what has quickly become known as ‘social-distancing’, but which roughly translates as closing down everything that’s non-essential and forcing people to stay at home.
However, there is one essential aspect about the UK strategy which seems a little mysterious and which I thought I might be able to shed a little light on with some Statistics.
You’re no doubt familiar by now with the term ‘herd immunity‘, though the phrase itself seems to have become a bit of a political hot potato. But whatever semantics are used, the basic idea is that once enough people in a population have been infected with the virus and recovered, the remainder of the population is also protected from further epidemic outbreaks. Why should that be so?
It’s nothing to do with virology or biology – antibodies are not passed from the previously infected to the uninfected – but is entirely to do with the statistical properties of epidemiological evolution. I’ll illustrate this with a much simplified version of a true epidemic, though the principles carry over to more realistic epidemiological models.
In a previous post I discussed how the basic development of an epidemiology in its initial exponential phase can be described by the following quantities:
- E: the expected number of people an infected person is exposed to;
- p: the probability an infected person will infect a person to whom they are exposed;
- N: the number of people currently infected.
The simplest epidemiological model then assumes that the number of new infections the next day will be
E \times p \times N
We’ll stick with that, but I want to make a slightly different assumption from that made in the video. In the video, when someone is infected, they remain infected indefinitely, and so are available to make new infections on each subsequent day. Instead, I want to assume here that a person that’s infected remains infected only for one day. After that they either recover and are immune, or, er, something else. But either way, they remain infective only for one day. Obviously, in real life, the truth is somewhere between these two extremes. But for the purposes of this argument it’s convenient to assume the latter.
In this case, if we start with N cases, the expected number of cases the next day is
E \times p \times N
The next day it’s
(E \times p)^2 \times N
And after x days it’s
(E \times p)^x \times N
This means that we still get exponential growth in the number of cases whenever E \times p is greater than 1; in other words, whenever an infected person will pass the virus on to an average of more than one person. But, critically, if E \times p is less than 1, (E \times p)^x \times N approaches zero as x grows and the epidemic dies out.
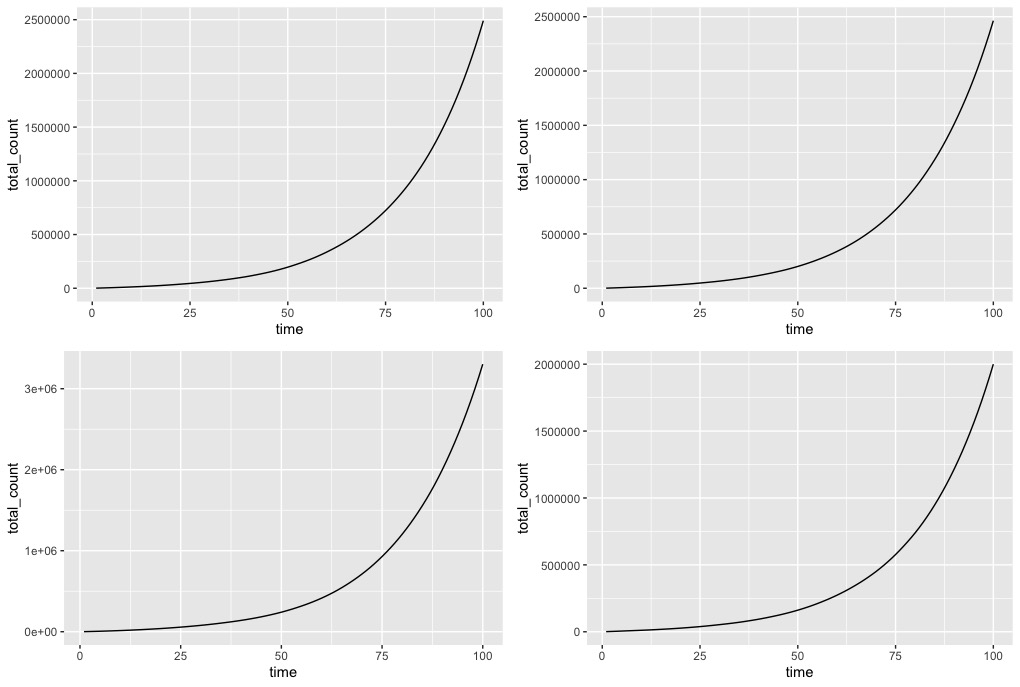
Here are some simulated trajectories. I’ve assumed we’re already at a point where there N=1000 cases and that the next day’s observations are a random perturbation around the expected value. First, let’s assume E \times p =1.05 – so each infected person infects an average of 1.05 other people daily. The following graphs correspond to four different simulated trajectories. If you look at the values of the counts, each of the simulations is quite different due to the random perturbations (which you can’t really see). But in each case, the epidemic grows exponentially.
But now suppose E \times p =0.95, so each infected individual infects an average of just 0.95 people per day. Again, the following figure shows four different simulations, each again different because of the randomness in the simulations. But now, instead of exponential growth, the epidemic tails off and essentially dies out.
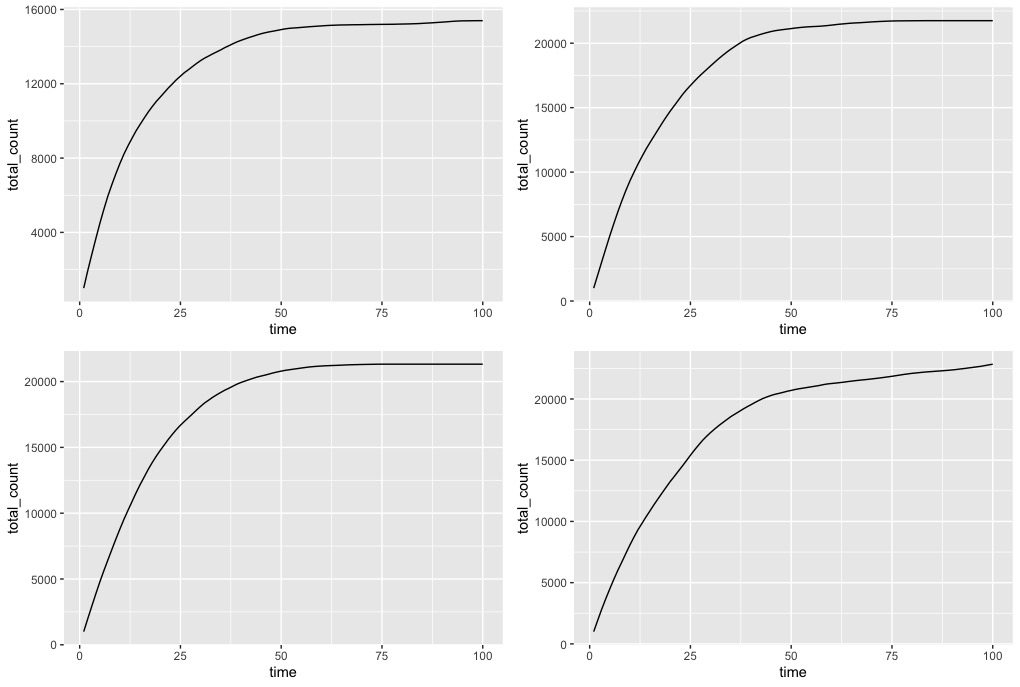
This is crucially important: when E \times p is below 1, meaning infected people infect less than one other person on average, the epidemic will just fade away. Now, as discussed in the previous post, changes to hygiene and social behaviour might help in reducing the value of E \times p, but unless it goes below 1, the epidemic will still grow exponentially.
But, suppose a proportion Q of the population is actually immune to the virus. Then an infected person who meets an average of E people in a day, will now actually meet an average of just E \times (1-Q) people that are not immune. So now the number of new infections in a day will be E \times (1-Q)\times p, and as long as E \times (1-Q)\times p is smaller than 1, the epidemic will tail off.
This is the basis of the idea of ‘herd immunity’. Ensure that a large enough proportion Q of the population is immune, so that the average number of people an infected person is likely to infect is less than 1. This is usually achieved through vaccination programs. By contrast, and in the absence of a vaccine, the stated UK government approach is to achieve a large value of Q by letting the disease spread freely within the sub-population of people who are at low risk of developing complications from the disease, while simultaneously isolating more vulnerable people. So, although many people will get the disease initially – since there is no herd immunity initially – these will be people who are unlikely to require long-term hospital resources. And once a large enough proportion of the non-vulnerable population has been infected, it will then be safe to put the whole population back together again as the more vulnerable people will benefit from the herd immunity generated in the non-vulnerable group.
Can this be achieved? Is it really possible to separate the vulnerable and non-vulnerable sections of the population? And will the spread of the disease through the non-vulnerable sub-population occur at the correct rate: too fast and hospitals can’t cope anyway (some ‘non-vulnerable’ people will still have severe forms of the disease); too slow and the ‘herd immunity’ effect will itself be too slow to protect the vulnerable section once the populations are re-combined. As explained in the thread of tweets above, the government has some control on this rate through social controls such as school closures and so on. But will it all work, especially once you factor in the fact that many non-vulnerable people may well take forms of action that minimise their own risk of catching the virus?
I obviously don’t have answers to these questions. But since I’ve found it difficult myself to understand from the articles I’ve read how ‘herd immunity’ works, I thought this post might at least clarify the basics of that concept.
‘Andrà tutto bene’ translates as ‘everything will be ok’, and has been adopted here in Italy as the slogan of solidarity against the virus. The picture at the top of the page is outside the nursery just up the road from where I live. As you walk around there are similar flags and posters outside many buildings and people’s houses. Feel free to print a copy of my picture and stick it on the office door.
