Racism in Italian Football
There’s plenty of evidence of individual episodes of racism in Italian football stadiums: here, here, here, here…. There’s also a well-documented history of racism in Italian football and an awareness of the issue from within the game. But does racism have any impact on match outcomes?
Consider the following hypothesis:
Hypothesis 1: Referees are biased against black players in Italian football.
A recent article in the academic journal Sociology – “Racial Bias in Fans and Officials: Evidence from the Italian Serie A” – explored this hypothesis in an interesting way. The authors didn’t treat race as a binary – black or white – issue. Rather, they chose to consider skin tone as a spectrum from white to black, and looked to see if the evidence supported a tendency for players with darker skin to receive harsher refereeing decisions.
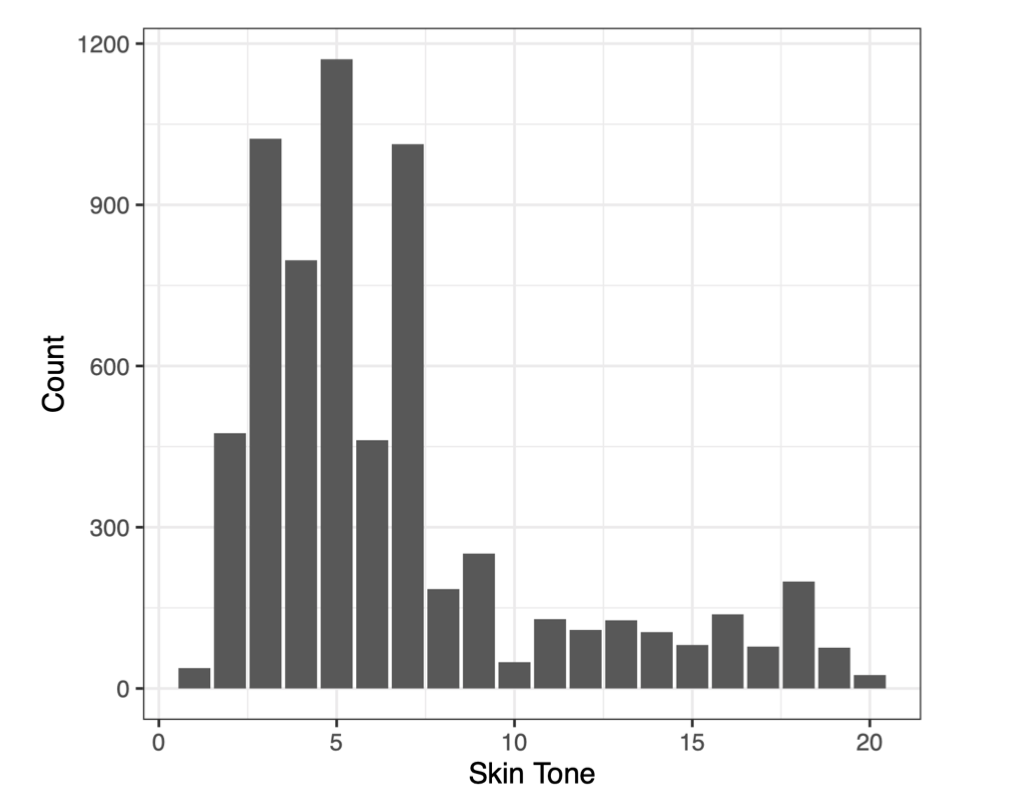
To do this, they did something neat. They extracted data from Football Manager, whose player data includes a skin tone for each player on a scale of 1 (lightest) to 20 (darkest). The following bar chart – taken from the article – shows the distribution of skin tones in their dataset.
Next, they collected data on different aspects of game play. They then put the two things together and built models to investigate whether variables like counts of yellow and red card counts varied according to a player’s skin tone. A bit of care is needed here. For example, players in certain positions might be more prone to red cards than others, and these positions might also tend to have more or fewer players of a lighter or darker colour. So, in making comparisons of red cards against skin colour, it’s also important to control for other factors like player position that might also impact on the chance of getting a red card.
The models they used are actually quite rudimentary, and one might question the validity of some of the assumptions made. Nonetheless, it’s likely that the conclusions reached are robust to those assumptions.
The main results are summarised in the following graphs, also taken directly from the article.
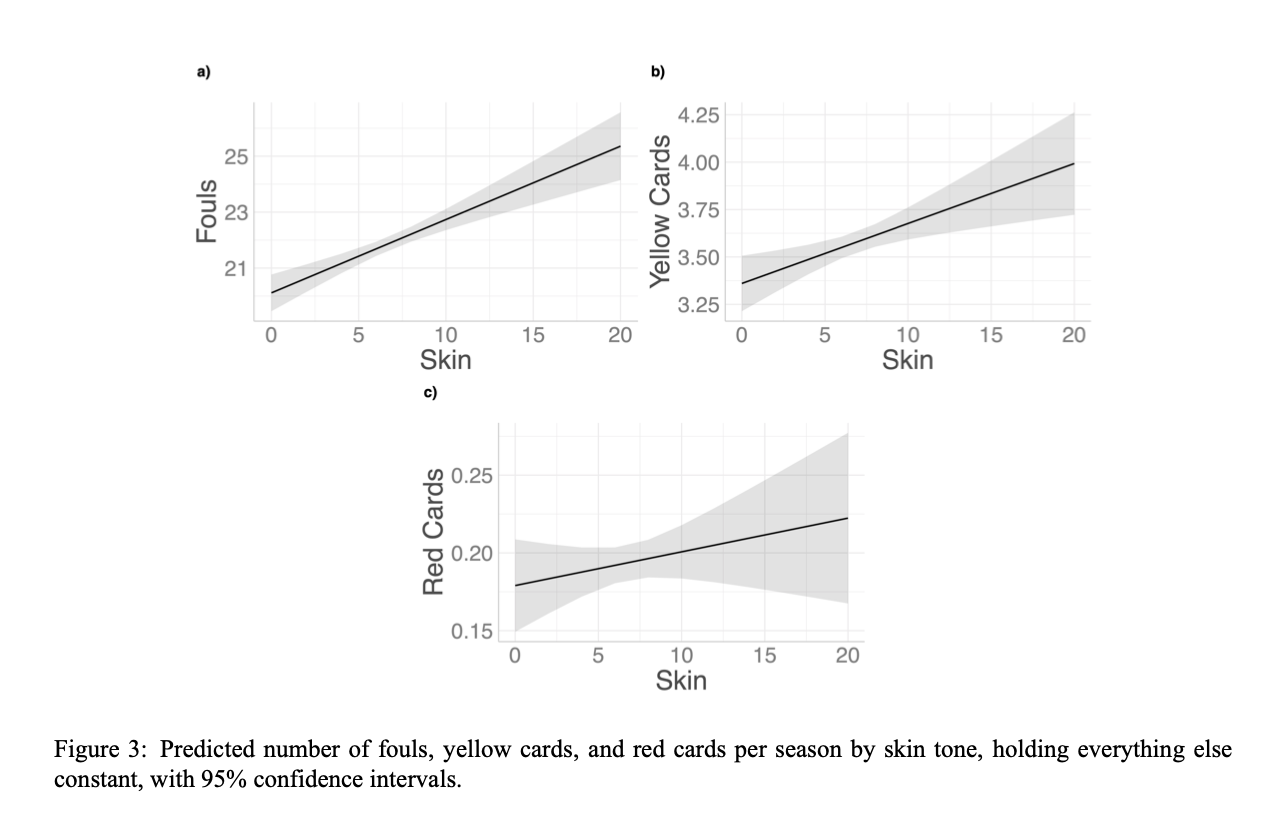
Clearly, the averages increase in each case with the darkness of skin tone. For fouls and yellow cards the evidence for this is very strong: all lines falling inside the 95% confidence bounds have a positive gradient. The evidence for red cards is weaker – for example, a horizontal line, corresponding to no dependence on skin tone, lies inside the confidence bound region. But this is more likely due to the fact that red cards are rare for players of all shades, so much more evidence is needed to produce the same level of certainty that an apparent effect is genuine. In any case, the overall conclusion is clear: referees seem to penalise players to a greater extent according to the colour of their skin tone.
A second hypothesis
So far, so convincing. The article then considers a second hypothesis:
Hypothesis 2: The bias in refereeing decisions towards black players is driven, at least in part, by racism from supporters
Assessment of this hypothesis required some additional ingenuity in terms of data construction.
At the time, Covid caused real complications for sports modelling. There were multiple effects taking place – playing after an enforced break of many weeks; the effect of Covid protocols on playing performance; multiple player absences due to infections; and the absence of supporters in stadiums – all of which required modelling assumptions on the basis of no entirely relevant data. In retrospect though, the Covid period now provides a reasonably large pool of games in which the effect of a crowd was removed. Things are complicated by the other effects mentioned above, but the lack of a crowd is likely to be dominant, so the Covid-period data can be used as part of a case-control study to examine the importance of crowd effects.
So, the authors of this study fit the same models as described above for the analysis of Hypothesis 1, but limited to the Covid period data. They find, by and large, that the racial bias effects were weaker during the Covid period, and argue that this provides some evidence that the effects shown in the graphs above are due to racism in crowds: i.e., when crowds are absent, as in the Covid period, the relationship between fouls and cards on skin colour is diminished, presumably due to less racial pressure on referees.
There is a caveat though: although the Covid era provided an uncommonly large number of games without crowds, it’s still a relatively small number of games compared to other periods. Consequently, the strength of evidence to support a change in levels of referee bias with skin tone is quite weak. But in part, this lack of evidence is due to the way the modelling has been done.
Essentially, the authors have fitted totally separate models for non-Covid and Covid eras. They argue this was necessary as Covid may have affected everything, so it would have been a mistake to model both sets of data together. Maybe, but the consequence is that the Covid era model has estimates whose precision is very low and it’s risky drawing all but the most tentative conclusions about effects. (To be fair, the authors claim nothing different from this.)
An alternative strategy would have been to combine the data into a single model, assume most of the effects to be common in non-Covid and Covid periods, but to allow just the effects of most interest (fouls, cards and their relationship to skin colour) to vary between these two periods. This would have required stronger assumptions, but there would be likely gains in being able to decide more definitively whether patterns in referee bias according to skin colour were different in the Covid period or not. Presumably, if there is an impact of crowds on refereeing decisions, it’s likely to be more more evident on the away team than on the home team. This doesn’t seem to have been considered in the article.
In Summary
- There is strong evidence that the darker a player’s skin tone, the more likely they are to have a foul awarded against them and to receive a yellow card.
- There’s weaker evidence of a similar effect for red cards.
- In games where no crowds were present – due to Covid – these effects were somewhat diminished, suggesting the bias is partly driven by racism among supporters and their influence on referees.
- Ingenuity is sometimes required in order to craft the appropriate data for examining a hypothesis.
- Good modelling is also needed to extract as much information as possible from the available data.
Follow-up
I received some helpful feedback to the above post.
Matthew wrote:
I’m not sure about the conclusion of this article. I think the only valid point is that there is a correlation between skin tone and being penalised. But we can’t automatically say that is due to ref racism.
And Benoit wrote:
I was wondering if correlation between their covariates could not lead to this like Simpson paradox? In my opinion they should split their model by position.
So, Matthew is saying that although there is a relationship between cards and skin tone, it would be wrong to conclude that was necessarily due to bias in referees. But Benoit is questioning even the basis of that relationship, saying it could be due to the influence of other effects that haven’t been included in the model.
If you’re wondering about the “Simpson’s Paradox” reference, I wrote a couple of posts about that in the early days of this blog: here and here. In the first of those posts I gave the example of MLB baseball players, Derek Jeter and David Justice. In each of the seasons 1995 and 1996, Justice had a higher batting average than Jeter, but over the two seasons combined, Jeter had the higher average. What’s actually happening there is that both players’ averages also changed considerably from one year to the other, and ignoring that aspect when pooling the data leads to the apparent contradiction. This is an example of Simpson’s Paradox, and Benoit is suggesting there may be a similar phenomenon in the racial bias study. That’s to say, the apparent relationship between cards or fouls and skin tone may actually be due to some other phenomenon that’s not been included in the analysis.
To be fair to the authors, they are aware of these issues, and have, for example, allowed for the fact that playing position is likely to be related to skin colour and the tendency to foul. Nonetheless, if the relationship between these variables is more complex than the one they assumed, it could lead to spurious conclusions as both Matthew and Benoit suggested. Without access to the data, it’s impossible to know if that’s actually the case or not.
Benoit also pointed out that there have been other studies with similar aims whose conclusions have either been different or less definitive than those of the article I discussed. In particular, this article describes a crowdsourcing project in which 29 teams of data analysts were given the same dataset and asked to investigate a possible relationship between red cards and skin tone. It concludes:
The major finding was that the results of the individual teams varied widely, from no effect to highly significant correlations between skin color and the rate of red cards, which some teams interpreted as indicative of a referee bias.
In other words, depending on how they handled the data, different teams gave contrasting solutions, and without access to the details analyses and the data, it’s impossible to know which is the more plausible.
All of which goes to prove, Statistics is never as simple as, er, black and white.
A bit more follow-up… Since adding to the discussion above, I got additional feedback from Johnny and Fabien.
Johnny made the point that there’s the potential with using data from the Covid period for a confounding with time effects. For example, suppose incidents of racism have been declining in recent years. It’s then likely that a comparison between Covid-seasons and earlier seasons will suggest there were fewer racially motivated incidents than would have been expected. But this isn’t because of Covid per se, or the consequent effect of having smaller or no crowds, but simply a result of a longer-term reduction in racial effects that most likely would have occurred anyway.
Fabien made two points. First, that although the analysis discussed in the post includes a control for player position, it doesn’t account for styles of play. Now, it’s difficult to find a way of writing this without leaving myself open to the charge of being racist myself, so please understand I’m just taking a devil’s advocate kind of role here. But suppose black players tend to play more aggressively than white players, regardless of the position they are playing in. Then they’re likely to get more fouls and cards awarded against them. Not because of the colour of their skin, but rather because of the additional risks they take as a cohort due to their style of play. This argument is obviously over-simplified, and it could be some other feature of gameplay that is more prominent among players of darker skin – perhaps they’re more likely than white players to whip their shirts off after scoring a goal – but you hopefully get the point.
Fabien’s second point was that in other sports there have also been studies which seem to confirm racial bias of one sort or another. For example, this study in NBA reveals a referee bias in favour of players of the same race; i.e. black referees are more lenient towards black players, white referees are more lenient towards white players. Matthew had also mentioned this study to me. Again, the conclusions of the study seem plausible, though as per the discussion above, it’s not impossible that alternative analyses of the same data would lead to different conclusions.
Thanks to everyone who sent me feedback so far, and please add to the discussion if you have other thoughts and ideas.
