
The UK, in common with all other countries that have managed to suppress the worst effects of the Coronavirus pandemic though strong social controls, must now decide how and when to move out of the current status. Inevitably, tensions pull in different directions. On the one hand, a strict lockdown that eliminates most social interactions is safest in reducing transmissions of the virus; on the other hand, a complete relaxation of the restrictions is bound to lead to the transmission rate returning to its previous levels and the epidemic growing again at an exponential rate. If the objective were simply to minimise COVID-19 deaths in the anticipation of a vaccine being found, or simply to slow down the infection rate so that health services are not overwhelmed, then maintaining the current lockdown would be the best strategy.
But as is becoming increasingly clear, this strategy is unsustainable in the long-term for economic, social and indeed other health reasons. Inevitably, then, the question turns to which restrictions can be lifted without the epidemic again spiralling out of control. Or more bluntly: is it even possible to keep the epidemic under control with anything less than a total lockdown?
Recall from an earlier post, that the main statistic in determining the trajectory of an epidemic is the transmission rate, R, which is the average number of people an infected person will subsequently infect. Recall also that the value of R=1 is critical to understand the epidemic’s path; greater than that and the epidemic will grow exponentially; lower, and it will begin to fade. So, can R be reduced below 1 without having a total lockdown?
This graph, taken from ‘A Sustainable Exit Strategy: managing uncertainty, minimising harm‘, by the Institute for Global Change, paints a somewhat negative picture. It suggests, based on experience in different countries, that the only situations where the value of R was kept below the value of 1 was through strict lockdown.
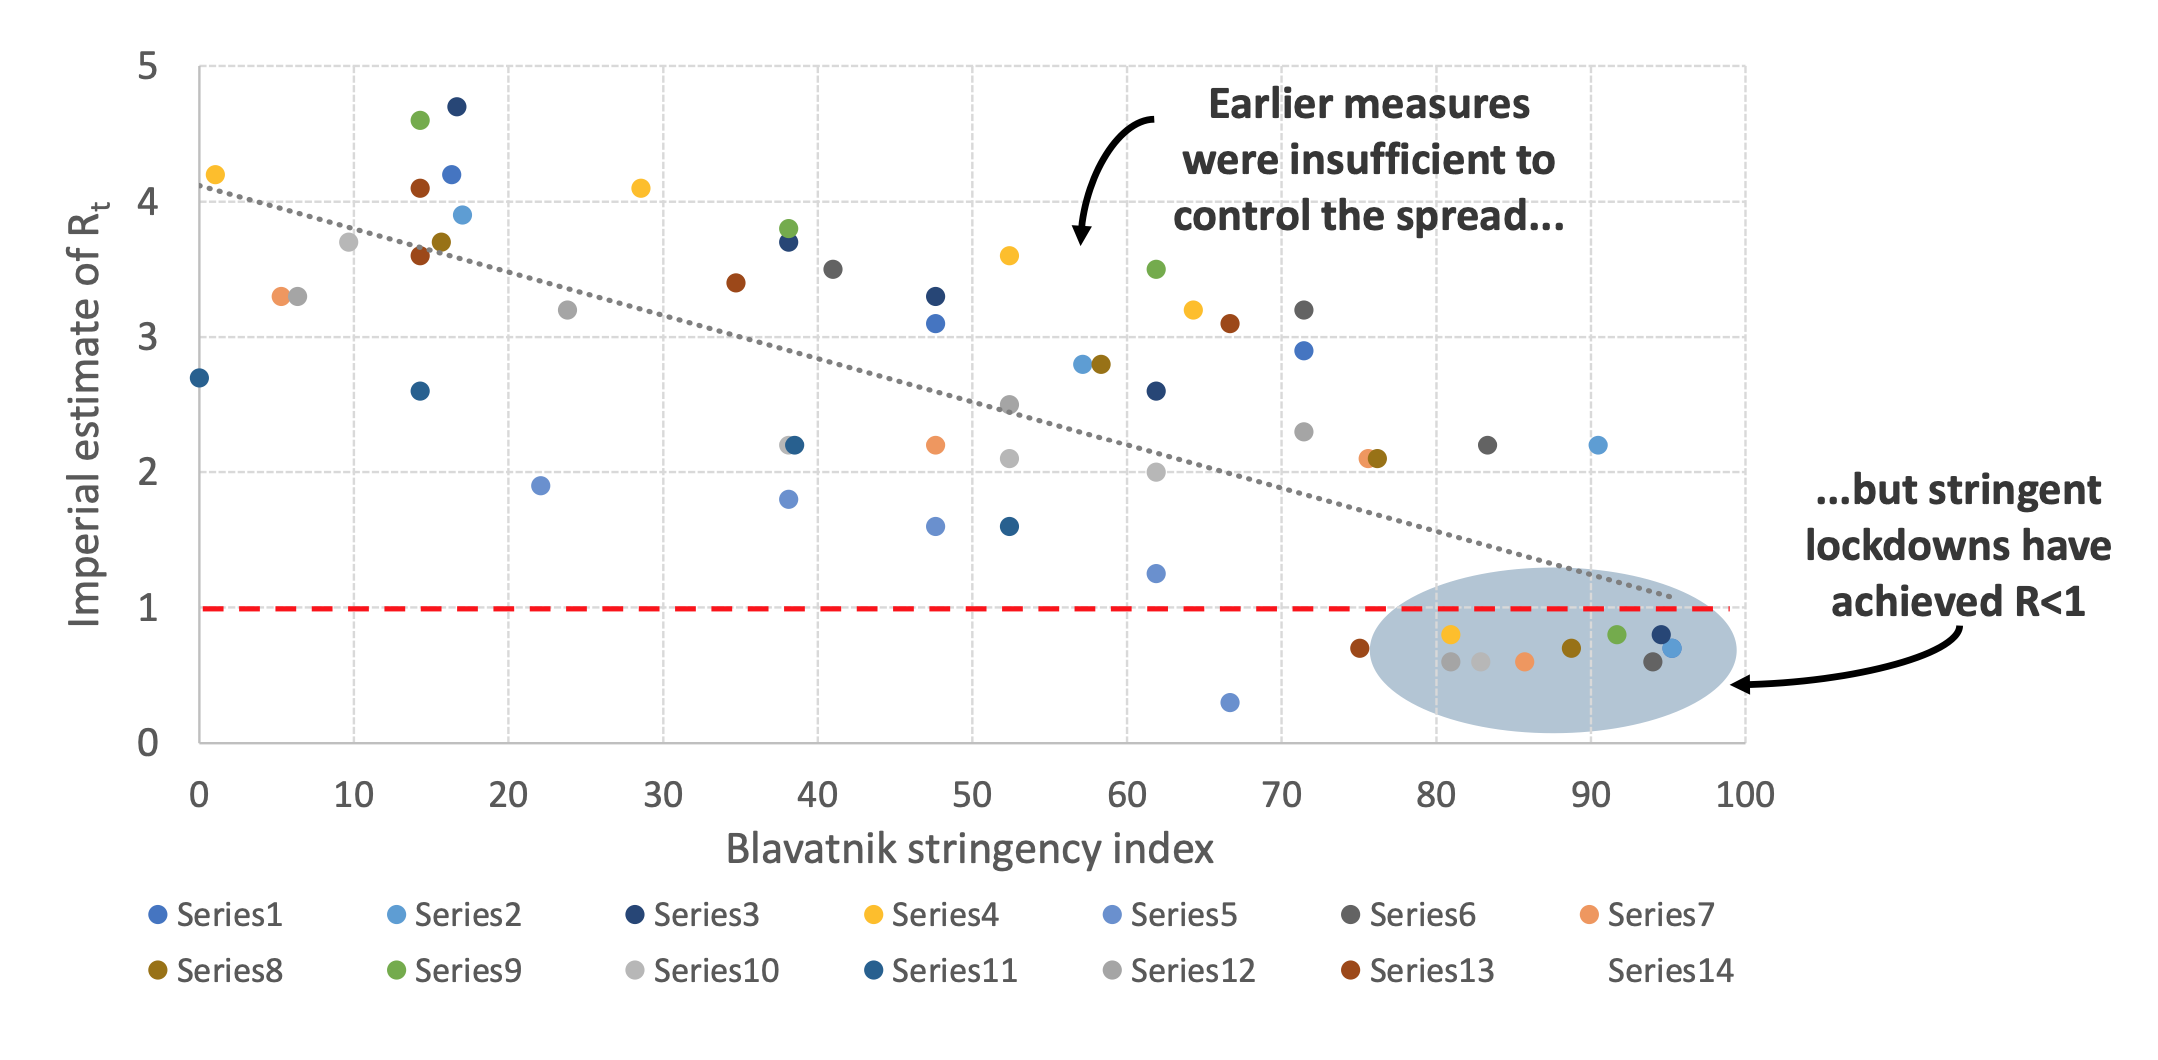
The report goes on to make suggestions as to how a ‘traffic light system’, where different strengths of measures – red/amber/green – might be enacted depending on the current numbers of new cases, perhaps on a regional basis. But there are obvious logistic difficulties to stopping and starting commercial and business activities, so the question arises as to whether a uniformly applied set of measures, that stop short of a total lockdown, can reduce R to levels below 1.
Since other European countries are now starting to relax restrictions, evidence on this will become available in the coming weeks. But a detailed statistical study from Hong Kong already provides some information. This study has been published in the Lancet, as linked to in the following tweet:
NEW—Study suggests testing & contact tracing & population behavioural changes—measures that have less disruptive social & economic impact than total lockdown—can meaningfully control #COVID19: observational study of COVID19 & influenza in Hong Kong https://t.co/dvq1j6ZHyp @hkumed pic.twitter.com/vamL2h9NkV
— The Lancet Public Health (@TheLancetPH) April 17, 2020
The full report also can be found here.
Basically, the authors have mapped how the transmission rate of the disease has changed through time in Hong Kong, and related such changes to the social restrictions that were imposed at that time.
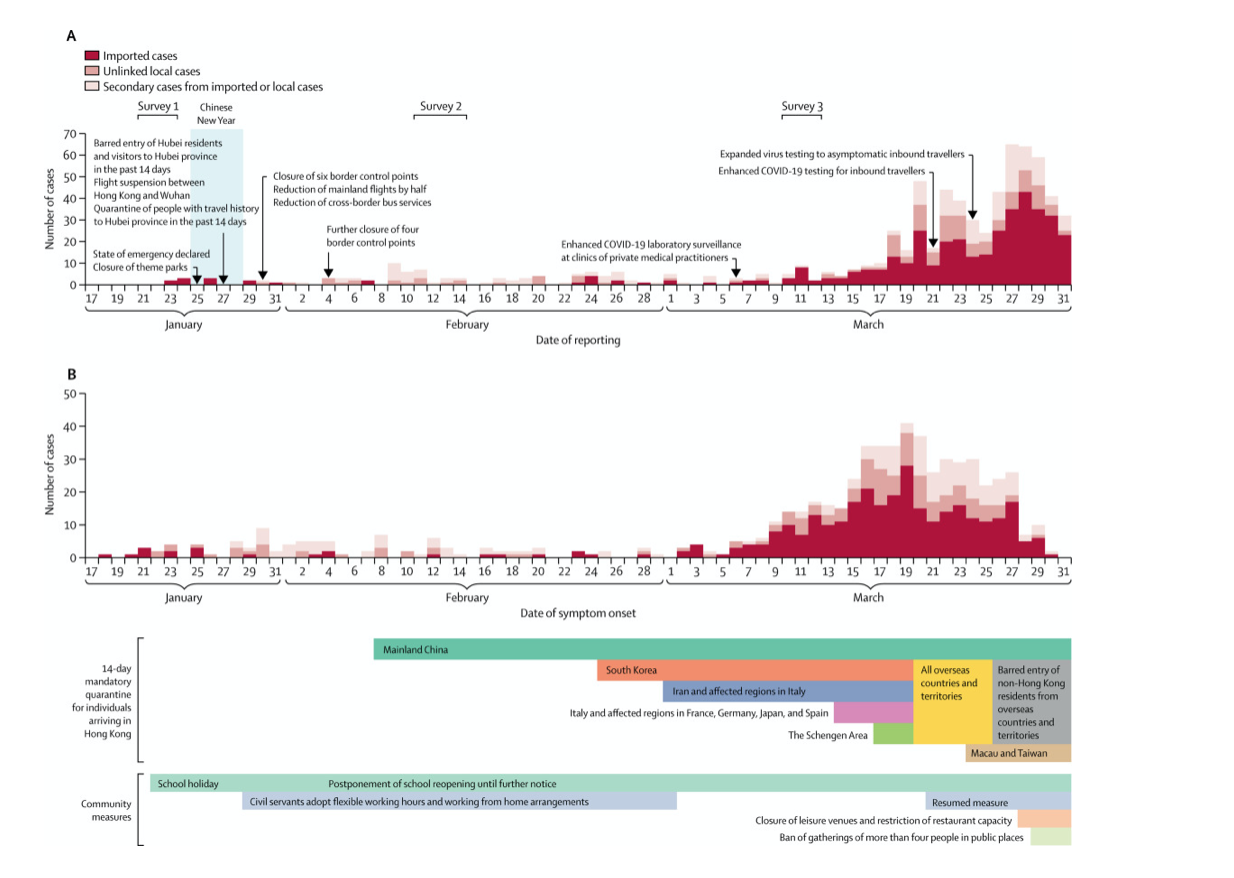
The following graph, taken from the report, shows the number of cases through to the end of March and the timing of restrictions that were imposed. At no point was a complete lockdown introduced in Hong Kong, though limitations on travel into the region and so-called community measures were introduced progressively in order to suppress the transmission rate.
Now compare this against a graph of the estimated transmission rate, R.
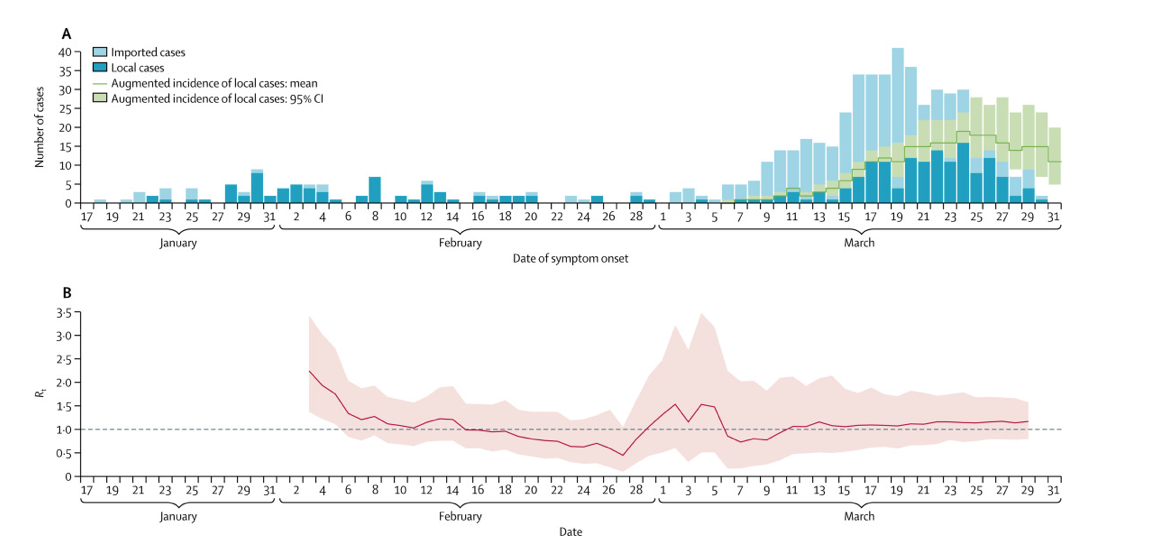
As you can see, the initial rate in Hong Kong was well above 2. The initial restrictions – mainly on travel and school restrictions – seemed to be sufficient to reduce the rate below 1 by the middle of February, but by the end of February there was evidence that the rate was creeping back above 1. Consequently, stricter restrictions were introduced, which seem to have stabilised the value of R to around 1. Admittedly, the best estimate of the current value of R is still slightly greater than 1, but the effect of the most recent restrictions are likely to take some additional days to filter through. Moreover, a value of R that is only very slightly greater than 1 does imply exponential growth, but at an initial rate that is likely to be manageable.
So, the Hong Kong experience – as evidenced by detailed statistical analysis – is that travel and community restrictions that fall substantially short of a total lockdown, can be sufficient in reducing Coronavirus transmission rates to levels that avoid the epidemic growing out of control. That said, there are obviously many other differences between the UK and Hong Kong, including demographic and social differences, as well as other aspects of epidemic control, so what works for Hong Kong may not be reproducible exactly in the UK. Nonetheless, it’s encouraging that the epidemic can be controlled with measures that are less draconian than those currently in place.
