I’m a terrible parent. My 18 year-old son will almost always beat me at anything: chess, skiing, cards, cycling… pretty much everything.
Except table tennis. We’re quite evenly matched, and our games could go either way. But, he’s got an awful temper when he loses, so although I don’t let him win exactly, I know I subconsciously ease off a bit when I’m winning, just so that he wins and we have a more peaceful afternoon. I know it’s wrong. I know losing is an important element for learning to improve. But there you are: I’m a terrible parent.
Am I any worse than Ollie C though? Ollie wrote to ask for some help in respect of a game he plays with his son. The game is Dobble and it works like this:
In the junior version of Dobble – which is the version Ollie plays with his son – there are 30 circular cards. Each card contains 6 images, as you can see in this figure:
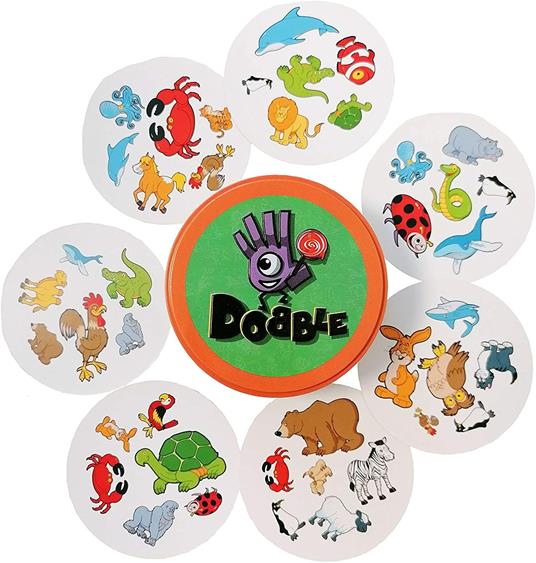
In total, there are 31 different images – in this version, animals – printed across the 30 cards. What makes the game work is that every pair of cards in the pack has just one image in common. For example, in the figure above, the top two cards share the dolphin. In the bottom 2 cards it’s the crab. And you can check similarly that any of the pairs of cards share exactly one image.
There are a number of variations for the actual gameplay, but I think the way Ollie and his son play is like this.
1. The cards are dealt face down, 15 each.
2. Players simultaneously turn over one of their cards.
3. The first player to identify the shared image wins that round.
4. The overall winner is the player who wins most rounds out of the 15.
Well, that’s how it should be played.
This is how matches between Ollie and his son are actually played:
1. The cards are dealt face down, 15 each.
2a. Ollie turns over one of his cards;
2b. Ollie’s son selects one of his cards but doesn’t turn it over:
3a. Ollie has to guess what the shared image is between his card and his son’s hidden card. If Ollie’s right, he wins the round.
3b. If Ollie’s wrong, Ollie’s son turns over his card and identifies the matching image, thereby winning the round.
4. The overall winner is the player who wins most rounds out of the 15.
Obviously, Ollie almost never wins like this. He calculated his chances of winning – correctly – as roughly 1-in-800 and wondered whether there was any strategy he could adopt to improve his chances. In other words, he won’t be a ‘good parent’ and confront his son about his cheating; he’d rather see whether there’s a statistical angle by which he can improve his odds of winning by stealth.
Anyway, let’s first verify the chances of Ollie winning when playing without a strategy. When he looks at his card he has to choose one of the images that he thinks will match one of the images on his son’s card. We know one is bound to match and the others won’t. So, with random selection the probability he’ll choose the one that matches is 1/6.
The game consists of 15 such rounds, in each of which Ollie has a 1/6 chance of winning. This type of experimental situation, where you have repeated trials with a constant probability of winning and you’re interested in the total number of wins, is called a Binomial model, for which the probabilities are easily calculated.
What we actually need is the probability Ollie wins at least 8 rounds, which is easily obtained in R as
> pbinom(7, 15, 1/6, lower.tail = FALSE)
[1] 0.001257451
Taking reciprocals this is roughly 1-in-800.
Now, in actual fact, Ollie can be smarter than just choosing from the images on his card at random. If he kept track of all the cards that have already been discarded in a game, it’s likely that some of the images will have occurred more often than others. Since all images occur almost equally often over the complete pack of 30 cards – and it’s only ‘almost’ for a reason I’ll explain below – the images that have already been discarded most often are the least likely to be the ones on his son’s card. And vice versa, the images that have been seen least often on the discarded cards are the most likely on Ollie’s son’s card. So, Ollie should choose one of the images on his card that has been seen least often already on discarded cards.
I don’t think the maths for this strategy is so straightforward, but the process is easy to simulate. There’s a smart algorithm here for generating a digital pack of Dobble cards, following which it’s easy to simulate the actual gameplay using any strategy.
In 100,000 simulations, using the card counting strategy explained above, the win probability turns out to be around 0.06, or around one-in-seventeen. These are much improved odds compared to the 1-in-800 win ratio when playing a random strategy, though playing against another human – e.g. Ollie’s son – would require the small task of keeping a running count of the number of times each of the 31 images has appeared on discarded cards.
An alternative suggested by Ollie is that he negotiates with his 5-year old son to be allowed to have 2 guesses per card instead of 1. The calculations for this version are straightforward: it’s exactly the same as the original random gameplay version, but where his chances of winning on each round are 2/6, or 1/3, instead of 1/6, by virtue of having 2 attempts rather than 1. So, again in R we get
pbinom(7, 15, 1/3, lower.tail = FALSE)
[1] 0.0882316
which implies win odds of around 1-in-11.
So, if Ollie can successfully conclude these negotiations with his son then his chances of winning are even better than with the strategy of keeping count of all discarded images.
So, you tell me. Does winning by either statistics-by-stealth or bribery make Ollie a better parent than me?
Postscript
There’s some very interesting and surprising mathematics connected to Dobble. In the Junior version there are 31 different images on 30 cards. In the Adult version (yes, you read that right) there are 57 different images on 55 cards.
These numbers are slightly curious. It would actually be possible to create a pack of 31 cards such that each card contained 6 images and any pair of cards shared exactly 2 images. In other words, the Junior Dobble pack has been designed with one card missing.
You might think that’s a choice made so that the number of cards is even. But in the adult version, where each card contains 8 images, you can generate 57 unique cards such that every pair of cards has exactly 2 images in common. So in this case the manufacturers have mysteriously dropped 2 cards from a potential Dobble pack of 57 cards.
No one seems to know why. Of course there are various theories on the internet, but none of them is very convincing.
The mathematics of how and why there could/should be 31 and 57 cards respectively in the kids and adult versions of Dobble is surprisingly complicated, and depends on the theory of finite projective planes.
Look at this diagram which connects lines to points. (Consider even the inner circle as a line).
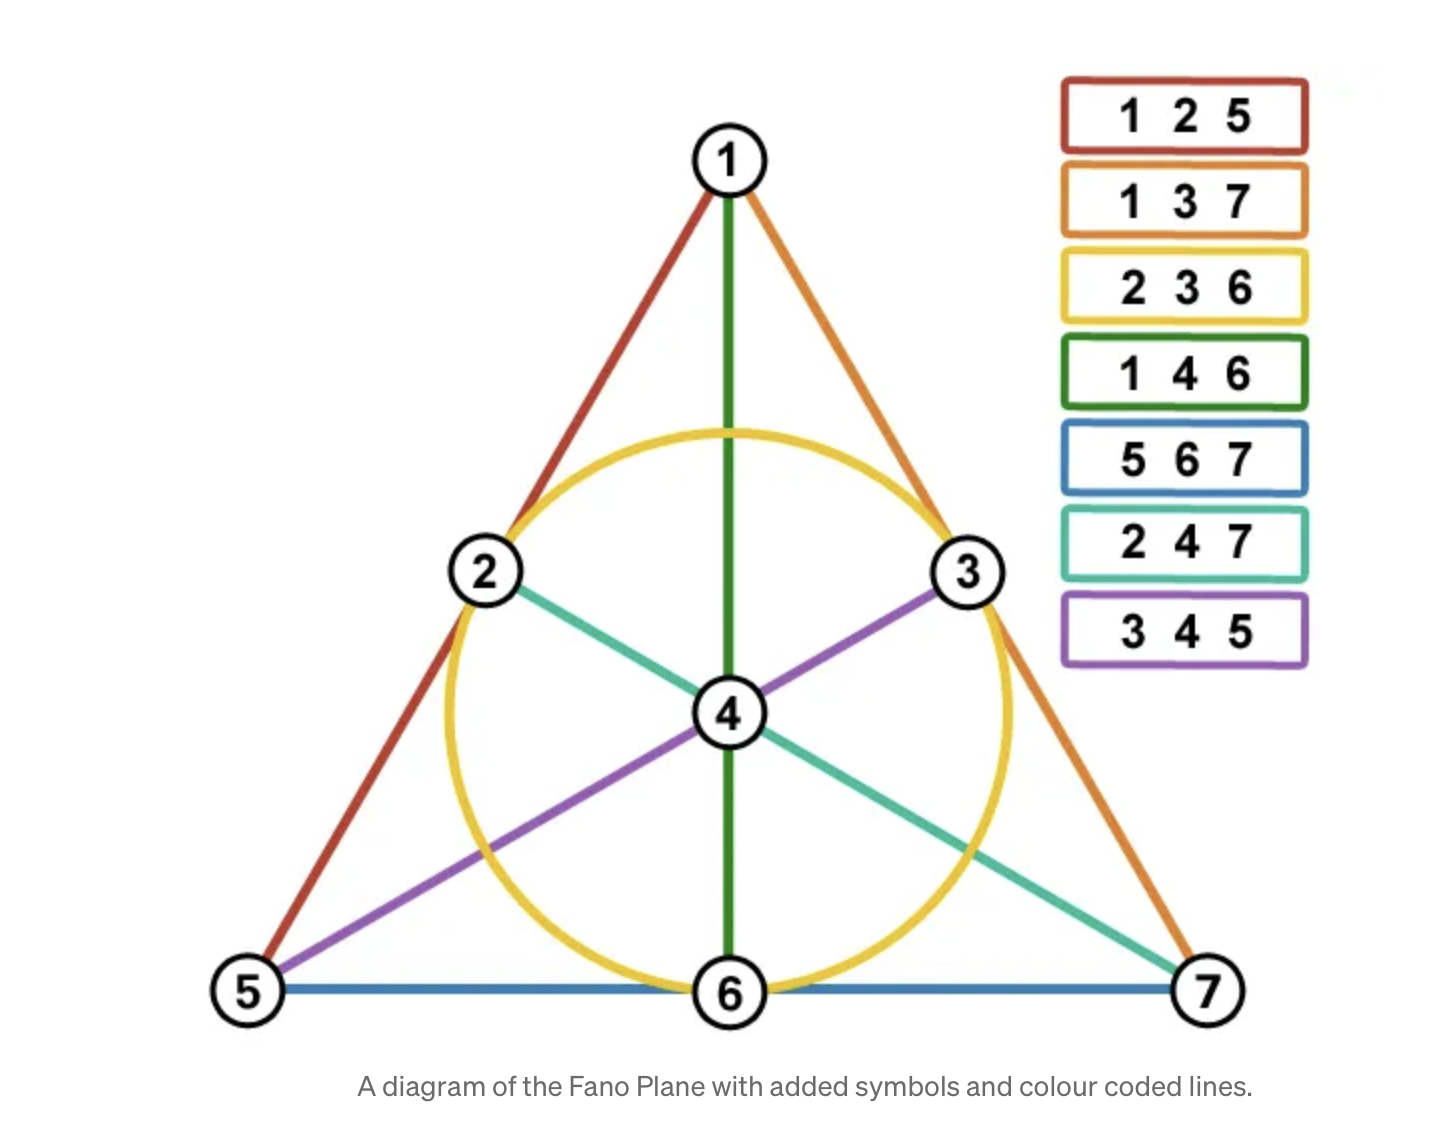
It has the property that every line contains 3 points and every pair of lines intersect in exactly one point. This is a geometrical equivalent of a pack of Dobble cards. If we think of the lines as the cards and the points as the images: every card contains 3 images and every pair of cards have just one image in common. In geometric terms, this is a Fano plane, which is a second order finite projective plane. And because of the parallels between its geometric properties and the overlap properties of Dobble cards, it can be used to generate a pack of Dobble cards, as also shown in the diagram.
The Fano plane, however, contains just 7 points and 7 lines, each containing 3 points. The Dobble pack it mirrors therefore contains 7 images and 7 cards, each of which contains 3 of the images. But this idea can be scaled up. Here’s a link to the 7-dimensional equivalent of a Fano plane which has similar equivalence to the 57-card pack of Dobble cards in the adult version of the game.
For an entertaining tour of this geometrical equivalence between projective planes and Dobble, I’d struggle to do better than this video.
